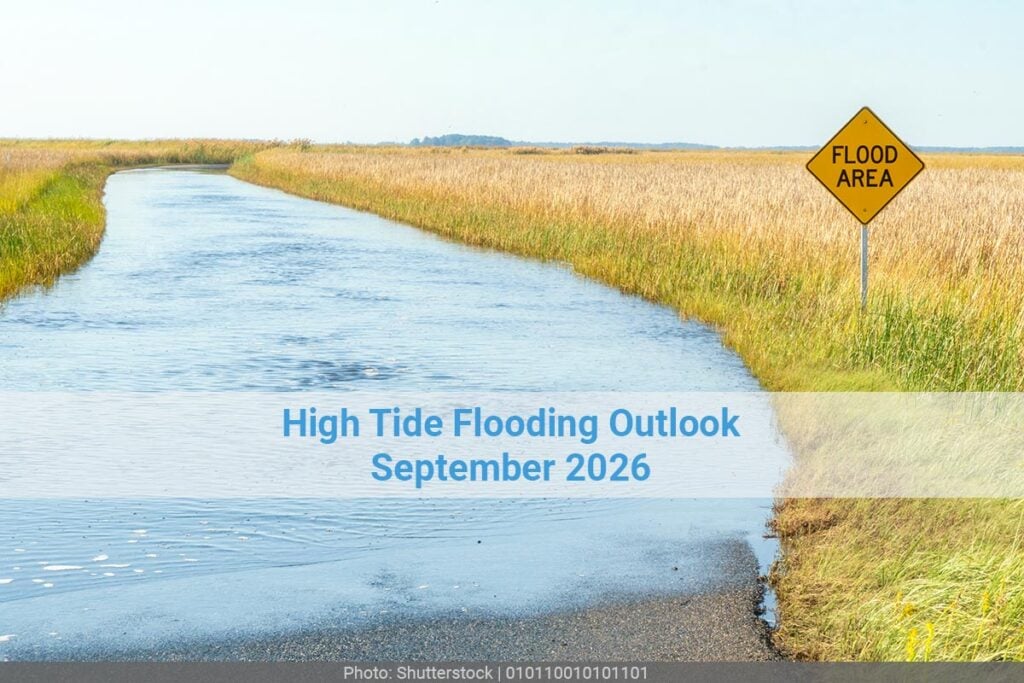
High Tide Flooding Outlook: September 2026
Mean sea levels are generally higher in the late summer and early fall months, due to warmer temperatures and weather patterns, and this month higher tides can be expected around the new moon on September 10 and the full moon on September 26. Expect the elevated water levels to persist for a day or two after each. The Mid-Atlantic, Southeast, Gulf Coast, and the Big Island of Hawaii are the regions most likely to see flooding this month. For most harbors in these areas, NOAA predicts a Slight Chance (now defined as a 5-20% likelihood of flooding) when using the National Ocean Service’s minor flooding threshold, measured against the Mean Higher High Water datum. Norfolk, Virginia, and the Outer Banks community of Duck, North Carolina, have a Medium Chance (up to a 40% likelihood), as will Trident Pier, Cape Canaveral, Florida; Eagle Point, Galveston Bay, Texas; and Hilo, Hawaii. Harbors on the West Coast, in contrast, are unlikely to see flooding this month.
Different thresholds will show more harbors at risk. We use the NOS minor threshold as our benchmark, as we have in previous reports, because its nationally consistent formula makes it the best basis for comparing flooding risk from one harbor to the next. The report can also be generated using the NWS minor threshold, which local forecasters and emergency managers calibrate to reflect where flooding actually causes problems in a specific community. NWS minor is not available at every station.
National Summary
25 harbors have an elevated chance of high tide flooding in September 2026.
- Northeast1 harbor
- Mid-Atlantic7 harbors
- Southeast8 harbors
- Gulf Coast6 harbors
- West Coast0 harbors
- Hawaii3 harbors
Astronomical Factors
- Sep 10 — New moon
- Sep 26 — Full moon
Northeast 1 Harbor
Low lying areas may flood, however high tides alone will likely not cause a significant impact on the coast in most areas unless accompanied by a storm or strong winds. Lower than normal low tides will also occur.
| Harbor | Threshold | Flooding Likelihoods & Dates |
|---|---|---|
| Kings Point, NY | 1.96 ft | Low RiskSep 11–12, 27–30 (peak 18.4%) |
Mid-Atlantic 7 Harbors
Some locations along the Mid-Atlantic coast will have their highest tides of the year. Minor tidal flooding along the coast will occur, particularly in low lying areas. If a storm occurs at this time, increased levels of tidal flooding and coastal erosion may occur. Lower than normal low tides will also occur.
| Harbor | Threshold | Flooding Likelihoods & Dates |
|---|---|---|
| Norfolk, VA | 1.75 ft | Moderate RiskSep 28–30 (peak 22.5%)Low RiskSep 1–4, 6–15, 25–27 (5.8%–18%) |
| Wachapreague, VA | 1.85 ft | Low RiskSep 8–14, 27–30 (peak 13.5%) |
| Lewisetta, VA | 1.70 ft | Low RiskSep 1–3, 6–15, 24–30 (peak 12.3%) |
| Windmill Point, VA | 1.75 ft | Low RiskSep 1–3, 8–14, 26–30 (peak 11.1%) |
| Kiptopeke, VA | 1.76 ft | Low RiskSep 12–13, 28–30 (peak 10.8%) |
| Cape May Canal, NJ | 1.86 ft | Low RiskSep 9–10, 29–30 (peak 8.1%) |
| Lewes, Breakwater Harbor, DE | 1.83 ft | Low RiskSep 29–30 (peak 7.4%) |
Southeast 8 Harbors
Minor tidal flooding along the coast will occur, particularly in low lying areas. If a storm occurs at this time, increased levels of tidal flooding and coastal erosion may occur. Lower than normal low tides will also occur.
| Harbor | Threshold | Flooding Likelihoods & Dates |
|---|---|---|
| Trident Pier, Cape Canaveral, FL | 1.76 ft | Moderate RiskSep 29–30 (peak 23.1%)Low RiskSep 27–28 (6.4%–12.8%) |
| Duck, NC | 1.79 ft | Moderate RiskSep 29 (peak 22.3%)Low RiskSep 8–14, 27–28, 30 (5.5%–19.2%) |
| Fort Pulaski, GA | 1.94 ft | Low RiskSep 8–11, 27–30 (peak 15.2%) |
| Myrtle Beach (Springmaid Pier), SC | 1.86 ft | Low RiskSep 28–30 (peak 9.8%) |
| Charleston, SC | 1.87 ft | Low RiskSep 9, 28–30 (peak 9.1%) |
| Mayport Naval Station, St Johns R, FL | 1.83 ft | Low RiskSep 28–30 (peak 8.4%) |
| Fernandina Beach, FL | 1.90 ft | Low RiskSep 9–10, 28–30 (peak 8.3%) |
| Beaufort, NC | 1.78 ft | Low RiskSep 29–30 (peak 7.5%) |
Gulf Coast 6 Harbors
In many locations of the Gulf Coast, the tidal range is relatively small compared to other regions of the U.S. so they will not be as significantly impacted by a perigean spring tide.
| Harbor | Threshold | Flooding Likelihoods & Dates |
|---|---|---|
| Eagle Point, Galveston Bay, TX | 1.62 ft | Moderate RiskSep 4–8, 16–22, 27–30 (peak 37.8%)Low RiskSep 1–3, 9–15, 23–26 (7.8%–19.8%) |
| Galveston Pier 21, TX | 1.70 ft | Low RiskSep 4–7, 16–21, 27–30 (peak 19.6%) |
| Bay Saint Louis, MS | 1.71 ft | Low RiskSep 3–8, 15–20, 29–30 (peak 15.7%) |
| Cedar Key, FL | 1.79 ft | Low RiskSep 1–5, 8–12, 14–16, 27–30 (peak 14.7%) |
| Dauphin Island, AL | 1.68 ft | Low RiskSep 4–7, 30 (peak 10.4%) |
| Pensacola, FL | 1.69 ft | Low RiskSep 4–8, 30 (peak 9.9%) |
West Coast 0 Harbors
Coastal flooding based primarily on tides is unlikely this month on the West Coast.
Hawaii 3 Harbors
Some stations in the Pacific Islands are predicted to exceed the high tide flooding threshold based on tides alone. Minor tidal flooding along the coast will occur, particularly in low lying areas. If a storm occurs at this time, increased levels of tidal flooding and coastal erosion may occur. Lower than normal low tides will also occur.
| Harbor | Threshold | Flooding Likelihoods & Dates |
|---|---|---|
| Hilo, Hilo Bay, Kuhio Bay, HI | 1.00 ft | Moderate RiskSep 8–9 (peak 33.7%)Low RiskSep 7, 10 (5.9%–16.1%) |
| Kawaihae, HI | 1.00 ft | Low RiskSep 7–9 (peak 10.5%) |
| Kahului, HI | 1.00 ft | Low RiskSep 8–9 (peak 10%) |
Note: A harbor’s absence from this list does not mean flooding is impossible. It means NOAA either has no sufficiently validated model for that location, or the local hydrodynamics make a prediction unreliable. NOAA does not currently model any station in Alaska. Real-time weather can cause flooding at any coastal location regardless of this outlook — within five days, refer to the National Weather Service.
Where the risk is this month
Pin colour shows each harbor’s highest flood likelihood for the month. Select a pin for its dates and threshold.
About this data
- Source
- NOAA Center for Operational Oceanographic Products and Services (CO-OPS), Monthly High Tide Flooding Outlook
- API
- Derived Products API (DPAPI), Daily Likelihoods endpoint
- Threshold
- NOS minor
- Datum
- MHHW
- Units
- English (feet)
- Model run
- August 10, 2026
- Includes
- Harbors with at least one day at or above 5% flood likelihood
Flood likelihoods come from a probabilistic model combining tide predictions, sea level rise trends and seasonal changes in coastal sea level. The model does not account for real-time weather.