High Tide Flooding Outlook for July 2026
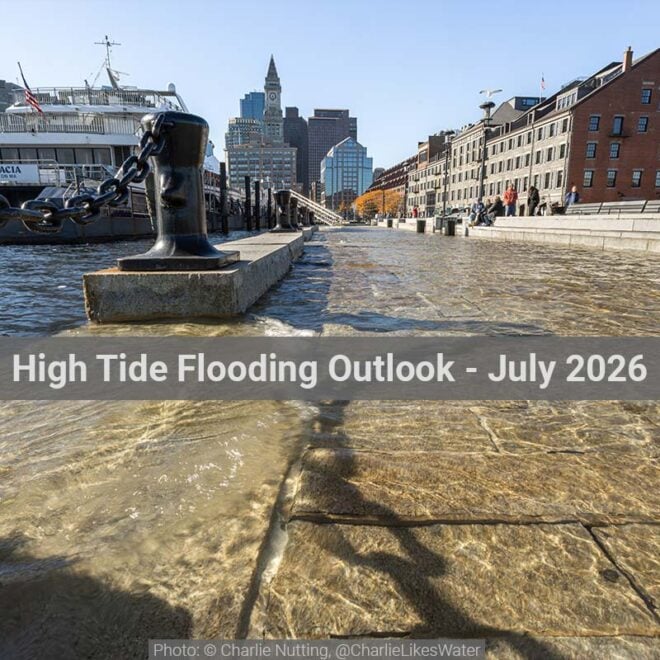
By US Harbors Monthly High Tide Flooding Outlook – July 2026 The East Coast, which last month saw some of its greatest potential for flooding during the entire year, will experience a reprieve in July as NOAA predicts that high-water events are only possible in Boston, Massachusetts; Portland and Bar Harbor, Maine; and Fort Pulaski, Georgia. The West Coast and Hawaii will not be so fortunate, with all harbors in the…
SEE HARBORS THAT MAY FLOODCoastal Inundation and Sea-Level Rise in the U.S.
US Harbors, in our commitment to the sustainability and vitality of coastal communities, works with municipal leaders, local residents, and regional, state, and federal agencies to help coastal communities around the country understand, and plan for, rising coastal water levels.
This microsite includes resources for education and planning purposes. It includes information about our program to disseminate affordable, low maintenance, water-level monitoring solutions so local communities have access to local tidal data.
Our programs and resources evolve daily as we understand more about the risks our communities are facing, and possible approaches we can take to ensure safety and preserve the quality of life on the coasts. Please let us know if you have a resource to share!
Have photos of high-tide flooding near you? Please share them with us.
Where to Start
REPORTS & GENERAL INFORMATION
- 2022 Sea Level Rise Technical Report (NOAA)— This document is designed for “decision makers” (although we think you all should know about it, even if you’re not a decision maker) and gives the most up-to-date sea level rise projections available for all U.S. states and territories.
- Climate Science Special Report: Fourth National Climate Assessment — As NOAA explains, this is an “authoritative assessment of the science of climate change and variability and its impacts across the United States, now and throughout this century.” Volume 1 includes a chapter on Sea Level Rise. Volume 2 includes a chapter on Coastal Effects.
- Flood Risk, Mapping, and Planning Tools (FEMA) — Helpful data and information on how to assess flood risk, strategies for mitigating long term hazards, and floodplain management support.
- Climate Resilience Toolkit (NOAA) — This toolkit, designed to help people find and use tools, information, and subject matter expertise to build climate resilience, offers information from across the U.S. federal government in one easy-to-use location.
- US Geologic Survey’s Microsite — The information on this site is significantly less technical than the resources above, but focuses on stories and issues in specific areas, and explains the basic concepts of what is happening on our coasts in easy to understand terms.
- US Harbors Online Conference on Rising Coastal Water Levels
- Book: “Moving to Ground: Rising Sea Level and The Path Forward” by John Englander.
TRENDS, PREDICTIONS, & REAL-TIME INTERACTIVE TOOLS
- Real-time Coastal Inundation Dashboard (NOAA) — This map shows current water levels, forecasts, and storm watches/around the country. This resource is helpful when looking to determine what areas will be impacted by extreme weather events.
- Coastal Flood Exposure Mapper (NOAA) — An interactive map to support communities assessing their coastal hazard risks and vulnerabilities. Users can create custom maps showing the impact of various types of coastal inundation on infrastructure, society, and local ecologies.
- The State of High-Tide Flooding and Annual Outlook (NOAA) — Interactive map and supporting information on past high-tide flooding events (also known as “sunny day”, or nuisance flooding) around the country. Also includes projections for the coming year and next several decades.
- Sea Level Rise Scenario Tool (NASA) — Interactive map with sea level scenarios for different locations around the country. Users can select decade projections and likelihood of scenarios.
- Sea Level Trends (NOAA) — Interactive map showing historical data of localized sea level rise trends at NOAA’s observational tide stations. It is important to differentiate from the published ‘average global sea level rise’ stat and what is actually documented by the hyper-local stations. Per NOAA: “The sea level trends measured by tide gauges that are presented here are local relative sea level (RSL) trends as opposed to the global sea level trend. Tide gauge measurements are made with respect to a local fixed reference on land. RSL is a combination of the sea level rise and the local vertical land motion.”
- Digital Coast Sea Level Rise Viewer (NOAA) — Interactive map showing communities that will be impacted by coastal flooding or sea level rise. Also includes water depth data, connectivity, flood frequency, socioeconomic vulnerability, wetland loss and migration, and mapping confidence.