Arctic sea ice extent—the area where ice concentration is at least 15 percent—reached its apparent annual maximum on March 5, 2020. On March 24, the National Snow and Ice Data Center (NSIDC) reported that the 2019–2020 growth season had an unexceptional finish: 5.81 million square miles (15.05 million square kilometers). It was the 11th-lowest maximum in the 42-year satellite record.
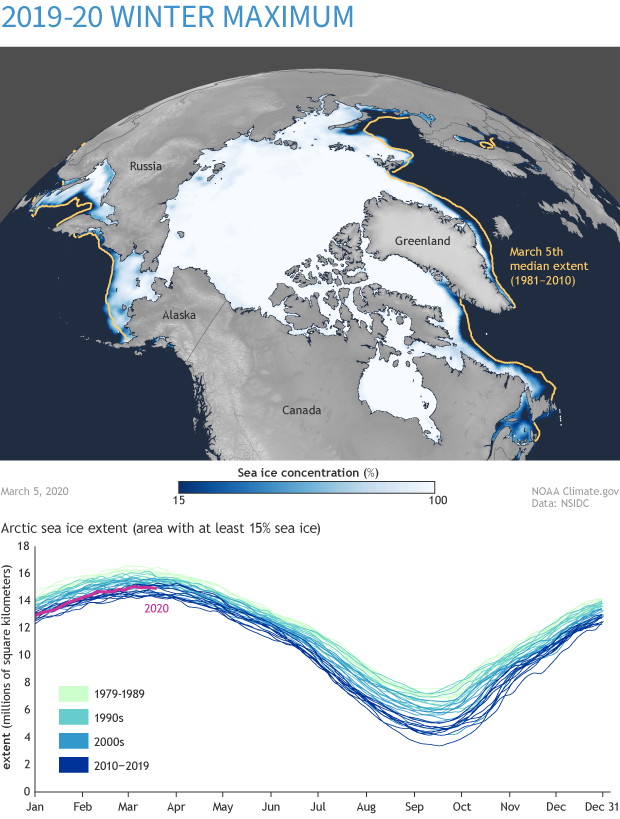
This color-coded map shows Arctic sea ice concentration on March 5, 2020. Darkest blue indicates open water or ice concentration less than 15 percent. Shades of lighter blue to white indicate 15–100 percent ice cover. The gold line shows the median ice extent for this date over 1981–2010, an area of 6.04 million square miles (15.64 million square kilometers). Median falls “in the middle” because half of the years in the 1981–2010 reference period had larger extents, and half had smaller extents.
Adapted from NSIDC’s Charctic tool, the graph shows daily Arctic sea ice extent for every year since continuous satellite monitoring began in 1979. Each year, the extent line follows a similar path: starting high in January, rising through the time of the maximum (between early March and mid-April), falling until mid-September, and rising again through the remainder of the calendar year. In this graph, extent-line shades range from light green (older decades) to deep blue (recent decades). The extent line for 2020 is dark pink, and the time series ends on March 19, 2020.
READ MORE at climate.gov