NOAA Fisheries Updates Report on Current Conditions of the Northeast U.S. Shelf Ecosystem
Posted
Last Updated
NOTE: This is a biannual report published by NOAA Fisheries. It was last updated this report on 10/27/22 and reflects document sea surface temperature trends, chlorophyll concentrations, fish distributions, etc. conditions in 2021 and early 2022.
Introduction
Current Conditions is a biannual report on ecosystem and fisheries data for the Northeast U.S. continental shelf ecosystem. The report includes measurements of temperature and salinity indicators of seasonal warming and cooling patterns. We derive indicators describing phytoplankton distribution and blooms from satellite remote sensing data. Northeast Fisheries Science Center bottom trawl surveys provide upper trophic level indicators of fish and macroinvertebrate habitat and distribution dynamics.
Note that some data elements usually reported in Current Conditions are not available for this report, as some of our surveys did not occur as planned. This would include bottom temperature, surface and bottom salinity, and modeling data related to fish distribution and habitat.
Summary
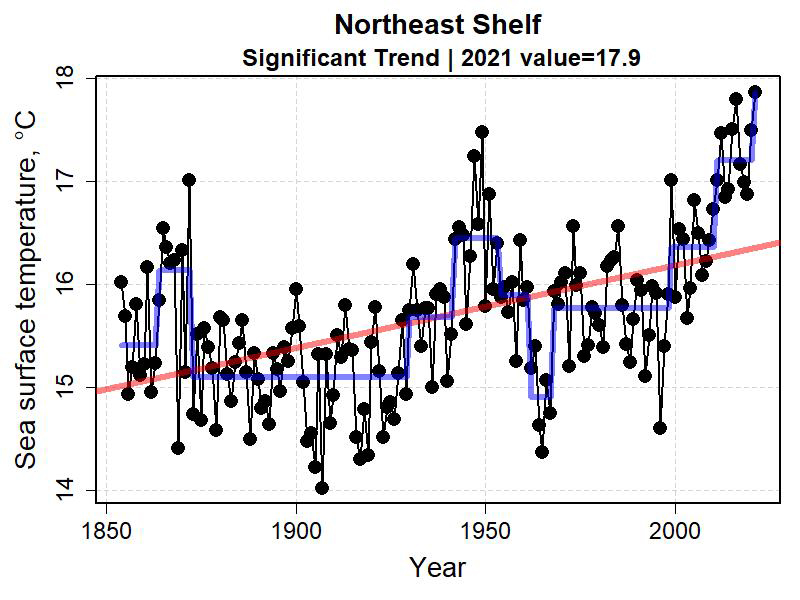
- During the last half of 2021, sea surface temperatures in the Northeast U.S. Shelf Ecosystem continued to be above average following a shift in thermal conditions that began around 2010. For some data series, temperature was at its highest level measured.
- Fall phytoplankton blooms were generally below average with the exception of Georges Bank, which had a large late-season bloom.
- The fall thermal transition continues to shift to progressively later in the year, raising concern over the timing of production cycles in the food web.
Temperature
Daily Sea Surface Temperature for the Last Half of the Year
Daily sea surface temperatures were at or generally above average conditions during the last half of 2021. The Georges Bank, Gulf of Maine, and Scotian Shelf ecoregions had the largest departures from average conditions where mid-summer temperatures were approximately 3°C above the average. In the Middle Atlantic Bight ecoregion, temperatures fluctuated around one standard deviation above the mean. In all areas, temperatures tended to moderate toward the mean by the end of the year.