NOAA Explains: Why Electronic Charts are Better Than Paper
Posted
Last Updated
By noaa.gov
NOAA Ocean Podcast: Episode 46
NOAA is moving into the digital age by phasing out paper nautical charts over five years. In this episode, we talk with NOAA Corps Capt. EJ Van Den Ameele, chief of Coast Survey’s marine chart division, to learn how this transition will affect mariners and why electronic charts offer many advantages over paper. And if you still need paper charts, Coast Survey has you covered. EJ discusses how an online tool called NOAA Custom Chart makes it easy to export printable charts for all maritime areas.

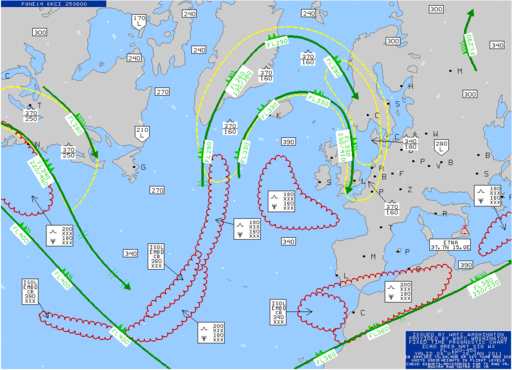
This is a view of a NOAA Custom Chart for the coast near San Francisco, California. With this free online tool, it’s easy to zoom in and explore this region, or any area covered by NOAA’s 3.2 million square nautical miles of charts. And once you find what you’re looking for, it’s just as easy to download a printable digital copy.
HOST: This is the NOAA Ocean Podcast, I’m Troy Kitch. Now here’s something most people don’t know that blew my mind when I first learned about it. The nation’s very first science agency was the Survey of the Coast, the predecessor of NOAA’s Office of Coast Survey, which is now part of NOAA’s National Ocean Service. And it goes way, way back to February, 1807, when President Thomas Jefferson signed an Act to provide for surveying the coasts of the United States. That’s where our nation’s nautical charts began … and for hundreds of years, these charts were printed on paper.
But it’s the digital age, and change is afoot. Our guest today is here to talk about the transition from paper to electronic nautical charts — and, for those out there who still want paper charts, how you can go to the Coast Survey website and select and export just the areas of an electronic nautical chart that you need. It’s called NOAA Custom Chart. We’re joined by NOAA Corps Captain EJ Van Den Ameele. EJ is the chief of the Marine Chart Division in the Office of Coast Survey. EJ, thanks for joining us. So what exactly is a nautical chart? What’s it for?
EJ Van Den Ameele: So a nautical chart is, at its essence, a roadmap of the sea. It’s a map of the ocean that shows you all of the information you need for a vessel, a boat, or a ship to navigate safely. So it’s things like how deep the water is, where land and coastline is, where dangerous navigation are like shoal water, obstructions, or wrecks, or something that might harm a vessel. It shows where safe water is, and it shows what we call aids to navigation, things like buoys and lighthouses and lights. So it’s all the information contained in a map of the ocean that enables you to navigate safely.
HOST: And the nautical charts NOAA creates cover all of the nation’s coastal waterways?
EJ Van Den Ameele: All of our charts cover 3.2 million square nautical miles. All of the waters that are claimed by the United States, that are essentially owned by the U.S., so that’s most waters that go about 200 miles off the U.S. shoreline, including the Great Lakes, including some of the Mississippi River, and Alaska and Hawaii and the Pacific Islands. So, yes, the nautical charts we produce in NOAA cover all U.S. waters.
HOST: So I guess the transition from print charts to digital charts shouldn’t be that surprising in the 21st century, but it is a really big change.
EJ Van Den Ameele: Over time, for hundreds of years, people navigated in the ocean using paper nautical charts. The earliest known paper nautical charts go back to the 11th century. I think about growing up, the daily routine my parents would go through to get their news from reading a newspaper. After they got home from work and before dinner, they’d like to sit on the couch and read the news: the full large-format newspaper. But over time, by the time I grew up, they read all their news on the computer. They got it all online. So it’s very much similar with our transition to electronics: we’re presenting the same information, but instead of doing it on a large sheet of paper we’re doing it on a computer screen.
Read more at noaa.gov