By HALEY THIEM
This year was a busy year for our team at Climate.gov providing updated maps, graphs, stories, and deeper explanations of our planet’s changing climate. There were many weather and climate events across the globe from extreme rainfall, to record warmth, and a major ENSO transition (just to name a few). So, before 2023 officially wraps up we want to highlight some of the stories, maps, and graphs that we brought you this year.
Extreme rainfall
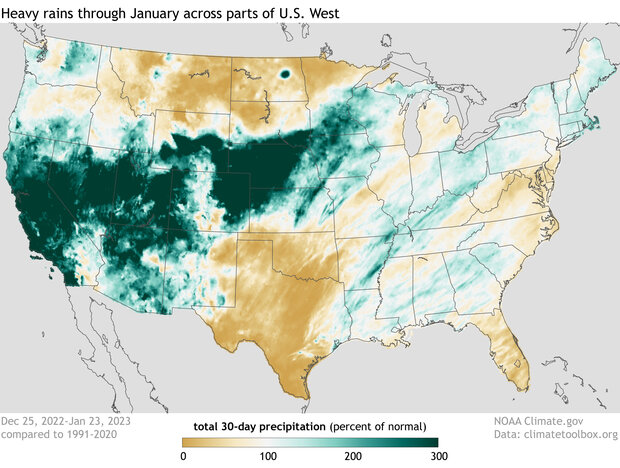
Percent of normal U.S. precipitation over the past 30 days (December 25, 2022, through January 23, 2023) after a series of weather events known as atmospheric rivers, fueled by tropical moisture, flooded the U.S. West with rain and snow. Places where precipitation was less than 100 percent of the 1991-2020 average are brown; places where precipitation was 300 percent or more than average are blue-green. NOAA Climate.gov image, based on analysis and data provided by the Climate Mapper website.
Percent of normal U.S. precipitation over the past 30 days (December 25, 2022, through January 23, 2023) after a series of weather events known as atmospheric rivers, fueled by tropical moisture, flooded the U.S. West with rain and snow. Places where precipitation was less than 100 percent of the 1991-2020 average are brown; places where precipitation was 300 percent or more than average are blue-green. NOAA Climate.gov image, based on analysis and data provided by the Climate Mapper website.