Take Your Head out of the Clouds to View the 2024 Total Solar Eclipse
Posted
Last Updated
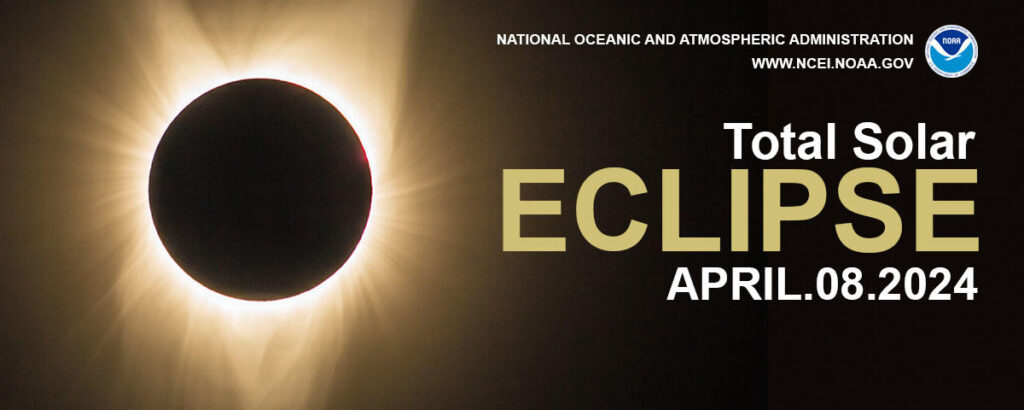
Spring is on its way and “springing into action” means more than just the seasonal cleaning spree. You can also use your time to see one of the best outdoor events of the year—the total solar eclipse! We know, we know, the lyrics from ‘total eclipse of the heart’ also spring to mind, but in order to see this spectacular event, climate conditions need to be just right so that everything aligns within your view. Luckily, we have a U.S. Climate Normals-based interactive map to help you out.
NOAA’s National Centers for Environmental Information (NCEI) can’t take all of the credit though. We’re proud to have reviewed past cloud conditions with scientists from the North Carolina Institute for Climate Studies (NCICS) to create an interactive map for the April 8, 2024 total eclipse!
The interactive map shows the average heat index, temperature, dewpoint, wind chill, and obscuration levels across the contiguous U.S.—these values may be useful for finding the best spot in your region for viewing the total eclipse.
You deserve to see the solar eclipse event and everything that entails—don’t forget to watch the shadows of leaf patterns change as the eclipse occurs. Click through the “April 2024 Total Solar Eclipse” map and as the event approaches, see the local weather forecast from NOAA’s National Weather Service (NWS) to help you find the best spot.
Decadal Updates For NCEI’s U.S. Climate Normals
Once a decade, NCEI generates the official U.S. Climate Normals to meet our user community needs. These requirements are also fulfilled at the request of the World Meteorological Organization (WMO) and NWS. The U.S. Climate Normals are intended to be ideal for anyone’s climate needs—from checking the average temperature for planning an outdoor wedding to deciding when to sow seeds for crops.
read more at ncei.noaa.gov.

