Tides Today & Tomorrow in Panama City, FL
Printing our tide charts?
Help us keep our doors open and lights on by registering as a member of US Harbors.
It's simple and free!
Panama City, FL Tides - Sep 1955
| Date | High Tide | Low Tide | Sun | Moon | ||||||||
|---|---|---|---|---|---|---|---|---|---|---|---|---|
| AM | ft | PM | ft | AM | ft | PM | ft | Rise | Set | |||
| 1 | Thu | 10:40 | 1.5 | 6:37 | 0.7 | 6:19 | 7:06 |  | ||||
| 2 | Fri | 12:35 | 1.0 | 11:44 AM | 1.4 | 3:51 | 0.9 | 6:33 | 0.9 | 6:19 | 7:05 |  |
| 3 | Sat | 12:34 | 1.1 | 12:54 | 1.3 | 5:30 | 0.8 | 6:08 | 1.0 | 6:20 | 7:04 | |
| 4 | Sun | 12:30 | 1.2 | 2:11 | 1.1 | 7:00 | 0.7 | 5:10 | 1.1 | 6:20 | 7:02 | |
| 5 | Mon | 12:13 | 1.4 | 8:37 | 0.7 | 6:21 | 7:01 | | ||||
| 6 | Tue | 12:28 | 1.6 | 10:22 | 0.5 | 6:21 | 7:00 |  | ||||
| 7 | Wed | 1:05 | 1.8 | 12:27 | 0.4 | 6:22 | 6:59 | | ||||
| 8 | Thu | 1:53 | 1.9 | 2:13 | 0.3 | 6:23 | 6:57 | | ||||
| 9 | Fri | 2:52 | 1.9 | 3:22 | 0.2 | 6:23 | 6:56 |  | ||||
| 10 | Sat | 4:11 | 1.9 | 4:17 | 0.2 | 6:24 | 6:55 | | ||||
| 11 | Sun | 6:09 | 1.9 | 5:05 | 0.2 | 6:24 | 6:54 | | ||||
| 12 | Mon | 7:40 | 1.9 | 5:47 | 0.4 | 6:25 | 6:53 | | ||||
| 13 | Tue | 8:53 | 1.8 | 6:21 | 0.6 | 6:25 | 6:51 |  | ||||
| 14 | Wed | 10:03 | 1.6 | 11:29 | 1.0 | 6:26 | 0.8 | 6:26 | 6:50 | | ||
| 15 | Thu | 11:16 | 1.4 | 11:22 | 1.2 | 3:30 | 0.9 | 5:38 | 1.0 | 6:26 | 6:49 | |
| 16 | Fri | 12:32 | 1.3 | 5:07 | 0.8 | 5:09 | 1.1 | 6:27 | 6:47 |  | ||
| 17 | Sat | 10:57 | 1.5 | 6:25 | 0.7 | 6:27 | 6:46 | | ||||
| 18 | Sun | 11:06 | 1.6 | 7:42 | 0.6 | 6:28 | 6:45 | | ||||
| 19 | Mon | 11:40 | 1.7 | 9:03 | 0.6 | 6:28 | 6:44 | | ||||
| 20 | Tue | 10:28 | 0.5 | 6:29 | 6:42 |  | ||||||
| 21 | Wed | 12:21 | 1.8 | 11:58 | 0.5 | 6:30 | 6:41 | | ||||
| 22 | Thu | 1:05 | 1.8 | 1:25 | 0.5 | 6:30 | 6:40 | | ||||
| 23 | Fri | 1:54 | 1.8 | 2:33 | 0.5 | 6:31 | 6:39 | | ||||
| 24 | Sat | 2:49 | 1.8 | 3:25 | 0.5 | 6:31 | 6:37 |  | ||||
| 25 | Sun | 3:54 | 1.7 | 4:03 | 0.5 | 6:32 | 6:36 | | ||||
| 26 | Mon | 5:28 | 1.6 | 4:29 | 0.6 | 6:32 | 6:35 | | ||||
| 27 | Tue | 7:17 | 1.6 | 4:38 | 0.7 | 6:33 | 6:34 | | ||||
| 28 | Wed | 8:35 | 1.5 | 10:39 | 1.1 | 4:37 | 0.8 | 6:34 | 6:32 | | ||
| 29 | Thu | 9:52 | 1.4 | 10:32 | 1.2 | 2:48 | 1.0 | 4:37 | 0.9 | 6:34 | 6:31 | |
| 30 | Fri | 11:16 | 1.3 | 10:26 | 1.3 | 4:18 | 0.9 | 4:23 | 1.1 | 6:35 | 6:30 | |
| Date | High Tide | Low Tide | Sun | Moon | ||||||||
| AM | ft | PM | ft | AM | ft | PM | ft | Rise | Set | |||
www.USHarbors.com
© 2026 US Harbors LLC All rights reserved
The US Harbors tide chart design is protected by copyright. It may be printed for personal use only.
Any commercial use, modification, redistribution, or repackaging without written permission is strictly prohibited.
Common Questions About Panama City, FL Tides
Show AllWhat time does the tide turn (slack tide) in Panama City, FL today?
Slack tide in Panama City, FL is approximately 1:30 am — midway between the next high and low tide, when tidal current is weakest. This is the preferred window for boat crossings, underwater visibility, and fishing in areas with strong currents.
Is this week a spring tide or neap tide in Panama City, FL?
Panama City, FL is currently in a spring phase. Tonight's moon is 13% illuminated. Spring tides (largest swings) occur near new and full moons; neap tides (smallest swings) occur near first and third quarter moons. Tidal ranges this week are near their weekly maximum.
What datum are Panama City, FL tide heights measured from?
Tide heights on this page are measured from Mean Lower Low Water (MLLW), the U.S. NOAA standard. A height of 0 ft represents the 19-year average of each day's lower low tide. Negative values indicate a "minus tide" — water levels below that long-term reference.
What factors can affect the tide predictions for Panama City, FL?
Tide predictions for Panama City, FL come from NOAA's harmonic analysis and are typically accurate within about ±10 minutes on timing and ±0.5 ft on height. Actual water levels can deviate further due to sustained winds, atmospheric pressure changes, river flow, and storm surge. During major weather events, be sure to check US Harbors weather pages for factors that could impact tidal predictions.
Which NOAA station provides tide data for Panama City, FL?
Tide data for Panama City, FL is sourced from NOAA Station #8729108. View the official NOAA station page at https://tidesandcurrents.noaa.gov/stationhome.html?id=8729108.
What is the moon phase in Panama City, FL tonight?
Tonight the moon over Panama City, FL is Waning Crescent (13% illuminated). This places Panama City, FL in a spring tide cycle, so tidal ranges are near their weekly maximum this week.
US Harbors Tidal Data
The data in our tide charts, tide tables, and tide graphs is provided by NOAA and others. These predictions are derived mathematically from numerous inputs, including data from historical tide stations and nearby locations where sensors are actively recording. As shown in the tide graph at the top of this page, “Predicted” tides (blue) are what forecasting models expect to happen. “Observed” tides (red) are those recorded by local sensors in real time, overlaid on the predictions for direct comparison. We display Observed water levels for a select group of harbors including Portland, Maine, where a physical sensor monitors water levels in real time.
FEATURED CONTENT
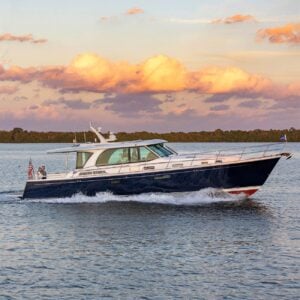
In The Zone: The Sabre 51 Salon Express
By US Harbors When Sabre Yachts completed construction of hull number 200 of its 48 Salon Express model, more than half the crew who built it had also worked on hull number one. The average tenure on that line was 12 years, and they produced a yacht that proved to… Learn More
Coastal News Updates See All
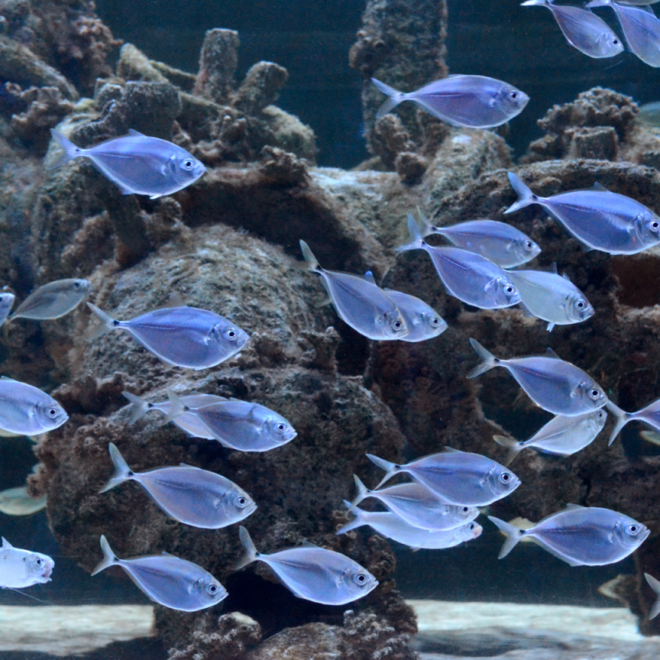
U.S. Aquariums and Universities Collaborate on Transformative Aquaculture of Marine Fish
By Seagrant.noaa.gov, Seagrant.noaa.gov. A nationwide collaboration among public aquariums and research institutions has developed new… More
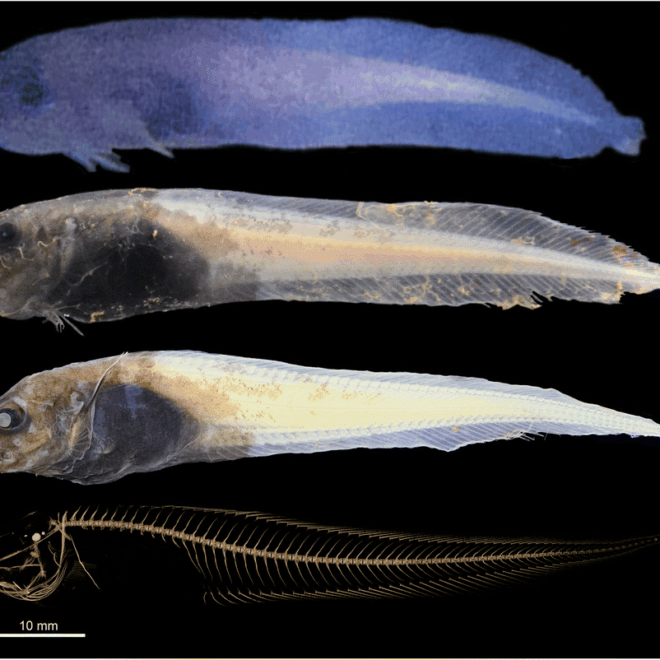
The Hadal Zone's Squishy Survivor: How the World's Deepest Fish Thrives Under Crushing Pressure
By Evan Lubofsky, whoi.edu. At the very bottom of the ocean — in the hadal… More
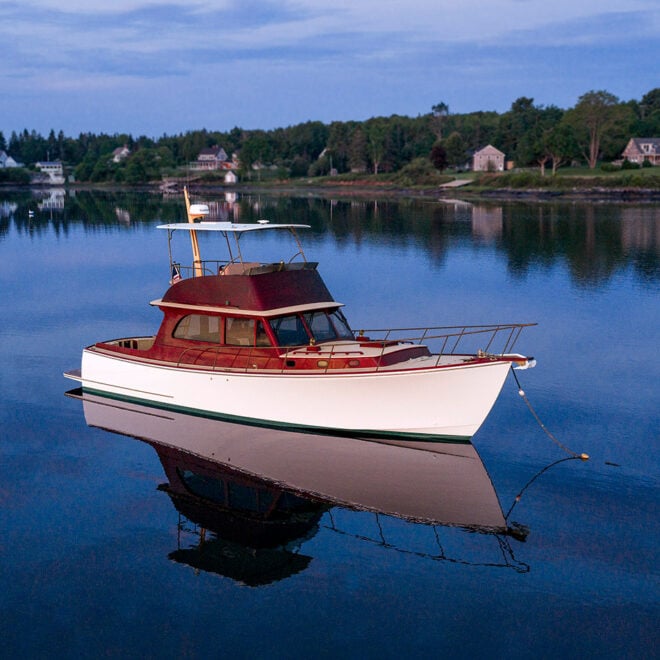
Quietly Sophisticated: The Hood 42 LM
By US Harbors At first glance, the Hood 42 LM might be confused for a… More
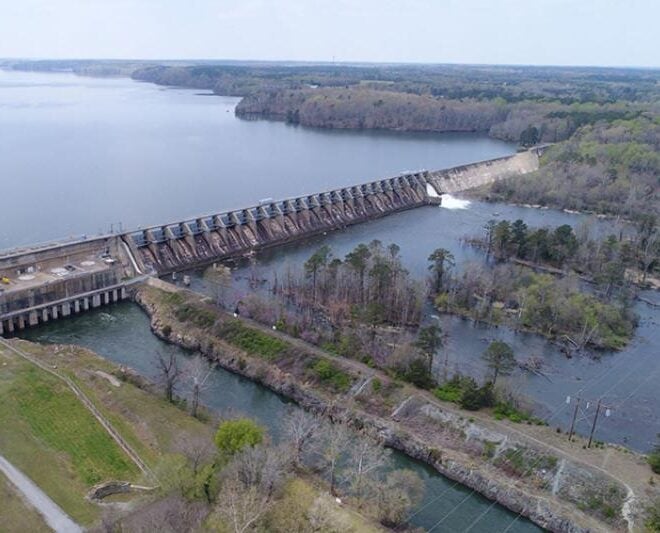
Balancing Energy Production and Aquatic Resources in the Roanoke River
By fisheries.noaa.gov, fisheries.noaa.gov. At the Roanoke Rapids Dam, a hydroelectric facility on the Roanoke River… More

NOAA’s Use Of Cloud Infrastructure Grows To Include Weather Prediction Models
By noaa.gov, noaa.gov. In the latest innovation to NOAA’s operational weather forecast model technology, the… More
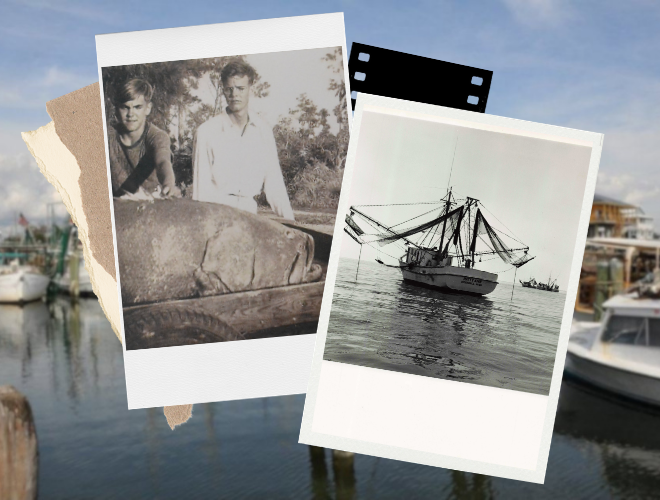
Gulf Fishery Management: Progress Through Partnership
By fisheries.noaa.gov, fisheries.noaa.gov. From spiny lobster in the Florida Keys to red snapper off the coast of Texas, the… More
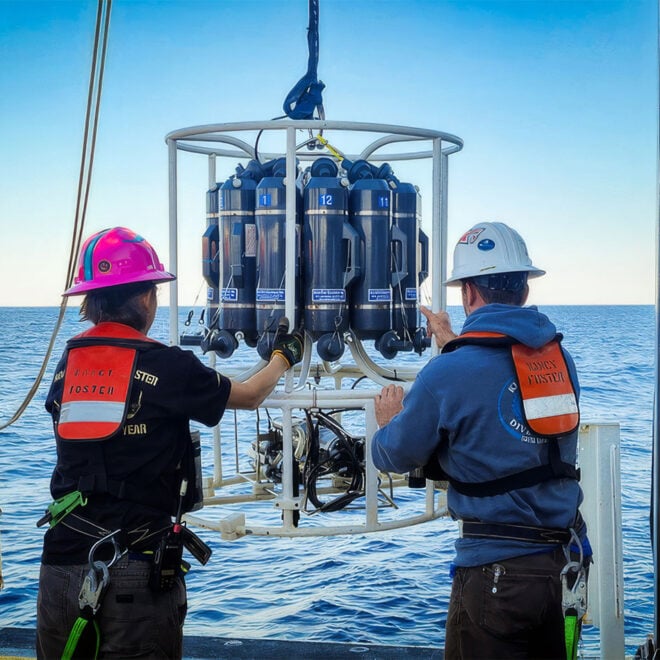
Why NOAA Matters: Maine's Island Institute Makes the Case
Why NOAA Matters: Maine's Island Institute Makes the Case Every mariner who checks a forecast… More
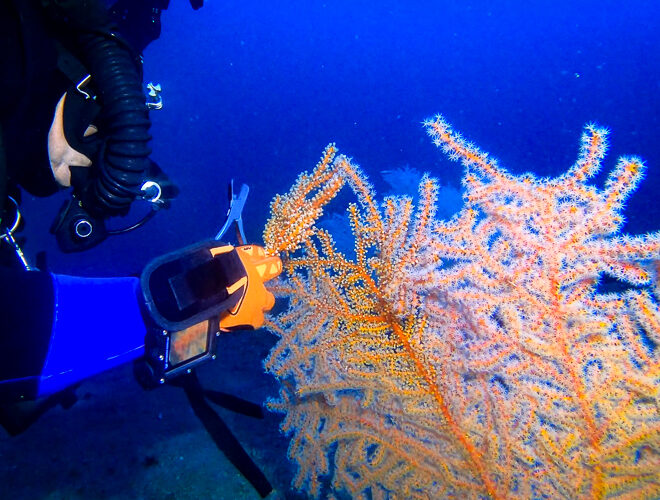
Deep Diving and Innovation to Restore the Gulf's Mesophotic Corals
By fisheries.noaa.gov, fisheries.noaa.gov. Deep in the Gulf of America lies a vital but little-known habitat.… More
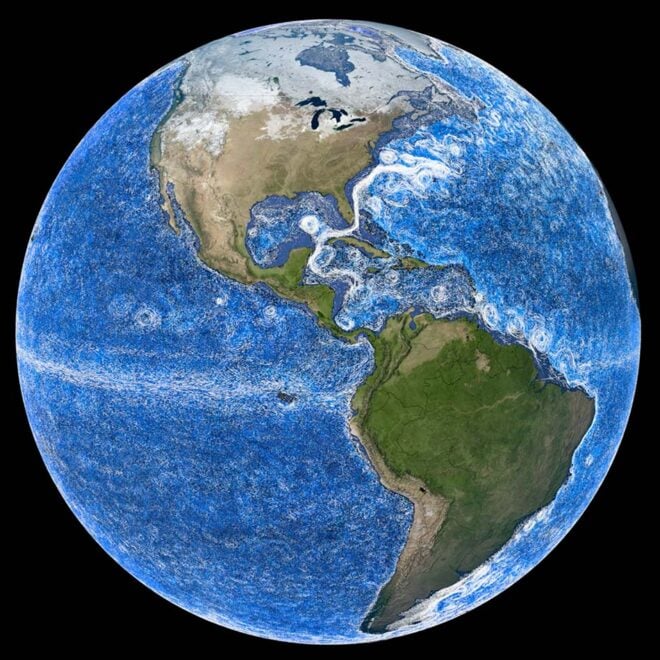
Going With The Flow: Visualizing Ocean Currents with ECCO
By James Riordon, science.nasa.gov. Historically, the ocean has been difficult to model. Scientists struggled in… More