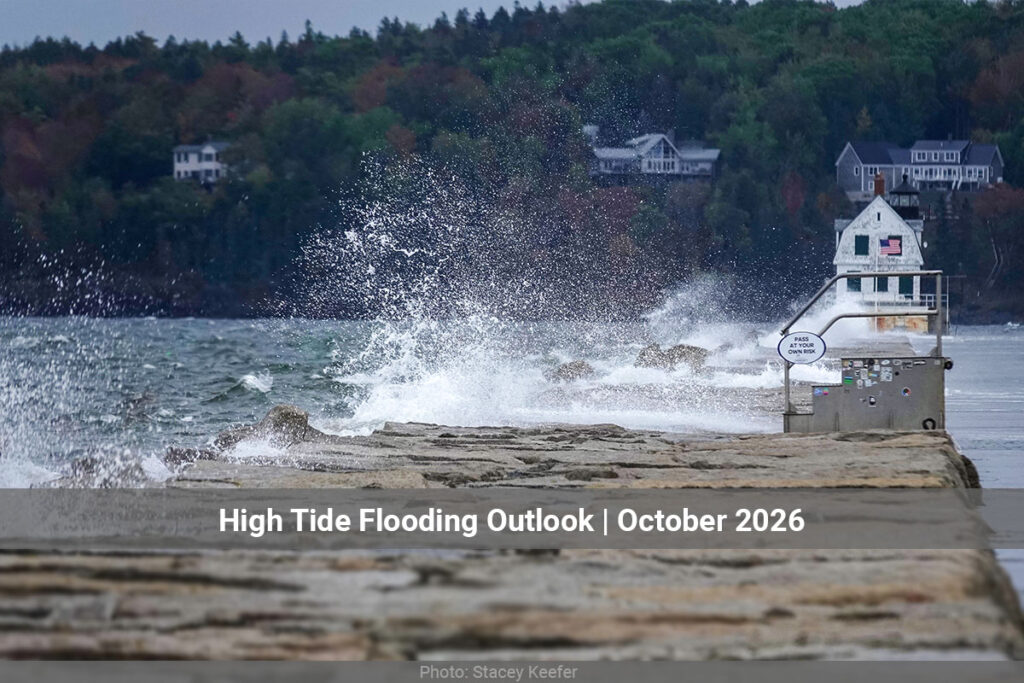
High Tide Flooding Outlook: October 2026
Seasonally higher sea levels carry into October, and this month higher tides can be expected around the new moon on October 10 and the full moon on the night of October 25–26. Expect the elevated water levels to persist for a day or two after each. The full moon window is the one to watch, with most harbors seeing their highest flood likelihood between October 26 and 29. Using the National Ocean Service’s minor flooding threshold, measured against the Mean Higher High Water datum, 43 harbors show some chance of flooding this month, up from 25 in September, and every coastal region in the outlook is represented. Twenty harbors reach a Medium Chance (a 20–60% likelihood), including most of the Mid-Atlantic coast. The Southeast, the upper Texas coast, Hawaii’s Big Island, and western Long Island Sound have the highest individual likelihoods, between 40 and 60% around the full moon. The rest of the Northeast and Gulf Coast see mostly a Slight Chance (5–20%), and the West Coast, quiet in September, has harbors on the list from Southern California to Washington.
National Summary
43 harbors have an elevated chance of high tide flooding in October 2026.
- Northeast7 harbors
- Mid-Atlantic10 harbors
- Southeast8 harbors
- Gulf Coast8 harbors
- West Coast6 harbors
- Hawaii4 harbors
Astronomical Factors
- Oct 10 — New moon
- Oct 26 — Full moon
National Summary
34 harbors have an elevated chance of high tide flooding in October 2026.
- Northeast4 harbors
- Mid-Atlantic10 harbors
- Southeast8 harbors
- Gulf Coast3 harbors
- West Coast6 harbors
- Hawaii3 harbors
Astronomical Factors
- Oct 10 — New moon
- Oct 26 — Full moon
Northeast 7 Harbors
Low lying areas may flood, however high tides alone will likely not cause a significant impact on the coast in most areas unless accompanied by a storm or strong winds. Lower than normal low tides will also occur.
| Harbor | Threshold (MHHW, ft)(MHHW, m)(MHW, ft)(MHW, m)(MSL, ft)(MSL, m)(STND, ft)(STND, m) | Flooding Likelihoods & Dates |
|---|---|---|
| Kings Point, NY | 1.96 ft0.60 m2.32 ft0.71 m5.87 ft1.79 m22.64 ft6.90 m | Medium ChanceOct 27–28 (peak 45%)Medium ChanceOct 9–10, 25–26, 29 (20%–32.5%)Slight chanceOct 1, 8, 11–12, 24, 30 (6.4%–16%) |
| Boston, MA | 2.05 ft0.62 m2.49 ft0.76 m7.12 ft2.17 m15.85 ft4.83 m | Medium ChanceOct 27–29 (peak 34.2%)Slight chanceOct 26, 30 (6.5%–8%) |
| Bridgeport, CT | 1.93 ft0.59 m2.27 ft0.69 m5.63 ft1.72 m11.23 ft3.42 m | Slight chanceOct 9–11, 25–29 (peak 19.9%) |
| Portland, ME | 2.04 ft0.62 m2.47 ft0.75 m7.00 ft2.13 m20.50 ft6.25 m | Slight chanceOct 27–29 (peak 19.5%) |
| Bar Harbor, ME | 2.10 ft0.64 m2.52 ft0.77 m7.80 ft2.38 m16.94 ft5.16 m | Slight chanceOct 26–29 (peak 19%) |
| Newport, RI | 1.79 ft0.55 m2.04 ft0.62 m3.91 ft1.19 m7.54 ft2.30 m | Slight chanceOct 10–11, 26–28 (peak 11.2%) |
| Providence, RI | 1.83 ft0.56 m2.08 ft0.63 m4.43 ft1.35 m10.16 ft3.10 m | Slight chanceOct 27–28 (peak 10.5%) |
Mid-Atlantic 10 Harbors
Minor tidal flooding along the coast will occur, particularly in low lying areas. If a storm occurs at this time, increased levels of tidal flooding and coastal erosion may occur. Lower than normal low tides will also occur.
| Harbor | Threshold (MHHW, ft)(MHHW, m)(MHW, ft)(MHW, m)(MSL, ft)(MSL, m)(STND, ft)(STND, m) | Flooding Likelihoods & Dates |
|---|---|---|
| Cape May Canal, NJ | 1.86 ft0.57 m2.29 ft0.70 m4.73 ft1.44 m9.72 ft2.96 m | Medium ChanceOct 26–29 (peak 31.8%)Slight chanceOct 1–2, 9–13, 25, 30–31 (5.4%–13.8%) |
| Atlantic City, NJ | 1.82 ft0.56 m2.24 ft0.68 m4.21 ft1.28 m11.38 ft3.47 m | Medium ChanceOct 26–29 (peak 31.5%)Slight chanceOct 1–2, 9–13, 25, 30–31 (6.1%–15.5%) |
| Sandy Hook, NJ | 1.85 ft0.56 m2.18 ft0.67 m4.50 ft1.37 m9.59 ft2.92 m | Medium ChanceOct 26–28 (peak 30.3%)Slight chanceOct 1, 9–12, 25, 29–30 (5.1%–13.6%) |
| New York (The Battery), NY | 1.84 ft0.56 m2.17 ft0.66 m4.33 ft1.32 m10.19 ft3.10 m | Medium ChanceOct 27–28 (peak 28.5%)Slight chanceOct 1, 9–12, 25–26, 29–30 (5.3%–18.8%) |
| Wachapreague, VA | 1.85 ft0.56 m2.17 ft0.66 m4.06 ft1.24 m8.65 ft2.63 m | Medium ChanceOct 26–29 (peak 28.1%)Slight chanceOct 1–14, 24–25, 30–31 (5.3%–19.3%) |
| Lewes, Breakwater Harbor, DE | 1.83 ft0.56 m2.25 ft0.69 m4.25 ft1.29 m9.26 ft2.82 m | Medium ChanceOct 27–29 (peak 27.4%)Slight chanceOct 1–3, 9–13, 25–26, 30–31 (5.6%–19.5%) |
| Norfolk, VA | 1.75 ft0.53 m1.96 ft0.60 m3.16 ft0.96 m8.89 ft2.71 m | Medium ChanceOct 10–11, 26–29 (peak 26.8%)Slight chanceOct 1–9, 12–15, 23–25, 30–31 (6.3%–19.5%) |
| Kiptopeke, VA | 1.76 ft0.54 m1.98 ft0.60 m3.27 ft1.00 m8.32 ft2.54 m | Medium ChanceOct 27 (peak 20.2%)Slight chanceOct 1–2, 8–13, 24–26, 28–30 (5.4%–18.5%) |
| Lewisetta, VA | 1.70 ft0.52 m1.84 ft0.56 m2.45 ft0.75 m7.98 ft2.43 m | Slight chanceOct 1–31 (peak 18.6%) |
| Windmill Point, VA | 1.75 ft0.53 m1.88 ft0.57 m2.44 ft0.74 m5.35 ft1.63 m | Slight chanceOct 1–16, 23–31 (peak 16%) |
Southeast 8 Harbors
Some locations along the Southeast coast will have their highest tides of the year. Some stations along the Southeast coast are predicted to exceed the high tide flooding threshold based on tides alone. Minor tidal flooding along the coast will occur, particularly in low lying areas. If a storm occurs at this time, increased levels of tidal flooding and coastal erosion may occur. Lower than normal low tides will also occur.
| Harbor | Threshold (MHHW, ft)(MHHW, m)(MHW, ft)(MHW, m)(MSL, ft)(MSL, m)(STND, ft)(STND, m) | Flooding Likelihoods & Dates |
|---|---|---|
| Trident Pier, Cape Canaveral, FL | 1.76 ft0.54 m2.11 ft0.64 m3.81 ft1.16 m23.69 ft7.22 m | Medium ChanceOct 26–29 (peak 59.7%)Medium ChanceOct 30 (32%–32%)Slight chanceOct 1–3, 9–13, 24–25, 31 (5.9%–19%) |
| Fort Pulaski, GA | 1.94 ft0.59 m2.31 ft0.70 m5.62 ft1.71 m12.94 ft3.94 m | Medium ChanceOct 27–28 (peak 44.6%)Medium ChanceOct 26, 29 (26%–26.5%)Slight chanceOct 1, 9–12, 25, 30 (5.4%–12.7%) |
| Duck, NC | 1.79 ft0.55 m2.11 ft0.64 m3.71 ft1.13 m24.06 ft7.33 m | Medium ChanceOct 26–29 (peak 34.4%)Slight chanceOct 1–3, 6–14, 24–25, 30–31 (5%–18.6%) |
| Myrtle Beach (Springmaid Pier), SC | 1.86 ft0.57 m2.25 ft0.69 m4.75 ft1.45 m36.76 ft11.20 m | Medium ChanceOct 27–28 (peak 24%)Slight chanceOct 26, 29 (14.2%–16%) |
| Mayport Naval Station, St Johns R, FL | 1.83 ft0.56 m2.10 ft0.64 m4.32 ft1.32 m15.86 ft4.83 m | Slight chanceOct 10, 26–29 (peak 19.8%) |
| Charleston, SC | 1.87 ft0.57 m2.23 ft0.68 m4.71 ft1.44 m10.40 ft3.17 m | Slight chanceOct 26–29 (peak 18.7%) |
| Fernandina Beach, FL | 1.90 ft0.58 m2.25 ft0.69 m5.17 ft1.57 m10.16 ft3.10 m | Slight chanceOct 11, 26–30 (peak 18.3%) |
| Beaufort, NC | 1.78 ft0.54 m2.07 ft0.63 m3.61 ft1.10 m7.16 ft2.18 m | Slight chanceOct 26–29 (peak 13.8%) |
Gulf Coast 8 Harbors
In many locations of the Gulf Coast, the tidal range is relatively small compared to other regions of the U.S. so they will not be as significantly impacted by a perigean spring tide.
| Harbor | Threshold (MHHW, ft)(MHHW, m)(MHW, ft)(MHW, m)(MSL, ft)(MSL, m)(STND, ft)(STND, m) | Flooding Likelihoods & Dates |
|---|---|---|
| Eagle Point, Galveston Bay, TX | 1.62 ft0.49 m1.66 ft0.51 m2.14 ft0.65 m7.01 ft2.14 m | Medium ChanceOct 26–27 (peak 43.6%)Medium ChanceOct 1–6, 9–20, 24–25, 28–31 (20.1%–38.9%)Slight chanceOct 7–8, 21–23 (15.4%–19.8%) |
| Galveston Pier 21, TX | 1.70 ft0.52 m1.78 ft0.54 m2.28 ft0.69 m7.49 ft2.28 m | Medium ChanceOct 1, 28–29 (peak 24.1%)Slight chanceOct 2–20, 24–27, 30–31 (5.2%–18.5%) |
| Bay Saint Louis, MS | 1.71 ft0.52 m1.85 ft0.56 m2.60 ft0.79 m5.86 ft1.79 m | Medium ChanceOct 2 (peak 20.1%)Slight chanceOct 1, 3–5, 11–17, 26–31 (6.1%–18.5%) |
| Dauphin Island, AL | 1.68 ft0.51 m1.70 ft0.52 m2.33 ft0.71 m5.77 ft1.76 m | Slight chanceOct 1–5, 12–16, 26–31 (peak 19.1%) |
| Morgans Point, Galveston Bay, TX | 1.76 ft0.54 m1.83 ft0.56 m2.36 ft0.72 m8.22 ft2.50 m | Slight chanceOct 1–6, 10–20, 25–31 (peak 14.1%) |
| Pensacola, FL | 1.69 ft0.52 m1.72 ft0.52 m2.33 ft0.71 m11.37 ft3.47 m | Slight chanceOct 1–5, 13, 27–31 (peak 12.4%) |
| Cedar Key, FL | 1.79 ft0.55 m2.13 ft0.65 m3.55 ft1.08 m7.40 ft2.25 m | Slight chanceOct 1–2, 27–30 (peak 11.3%) |
| Port Isabel, TX | 2.06 ft0.63 m2.12 ft0.65 m2.62 ft0.80 m7.29 ft2.22 m | Slight chanceOct 28–30 (peak 6%) |
West Coast 6 Harbors
Minor tidal flooding along the coast will occur, particularly in low lying areas. If a storm occurs at this time, increased levels of tidal flooding and coastal erosion may occur. Lower than normal low tides will also occur.
| Harbor | Threshold (MHHW, ft)(MHHW, m)(MHW, ft)(MHW, m)(MSL, ft)(MSL, m)(STND, ft)(STND, m) | Flooding Likelihoods & Dates |
|---|---|---|
| North Spit, Humboldt Bay, CA | 1.92 ft0.58 m2.63 ft0.80 m5.07 ft1.55 m23.32 ft7.11 m | Medium ChanceOct 27–28 (peak 32.3%)Slight chanceOct 26, 29 (8.8%–12.5%) |
| San Diego, CA | 1.87 ft0.57 m2.61 ft0.80 m4.65 ft1.42 m11.38 ft3.47 m | Slight chanceOct 27 (peak 18.3%) |
| Toke Point, Willapa Bay, WA | 2.00 ft0.61 m2.74 ft0.83 m6.14 ft1.87 m15.44 ft4.71 m | Slight chanceOct 26–29 (peak 16.2%) |
| Newport Harbor, Yaquina River, OR | 1.98 ft0.60 m2.67 ft0.81 m5.86 ft1.79 m14.89 ft4.54 m | Slight chanceOct 27–28 (peak 13.5%) |
| Port Angeles, WA | 1.92 ft0.59 m2.47 ft0.75 m4.74 ft1.45 m39.30 ft11.98 m | Slight chanceOct 28 (peak 5.4%) |
| Charleston, OR | 1.95 ft0.59 m2.61 ft0.80 m5.49 ft1.67 m13.33 ft4.06 m | Slight chanceOct 27 (peak 5%) |
Hawaii 4 Harbors
Some stations in the Pacific Islands are predicted to exceed the high tide flooding threshold based on tides alone. Minor tidal flooding along the coast will occur, particularly in low lying areas. If a storm occurs at this time, increased levels of tidal flooding and coastal erosion may occur. Lower than normal low tides will also occur.
| Harbor | Threshold (MHHW, ft)(MHHW, m)(MHW, ft)(MHW, m)(MSL, ft)(MSL, m)(STND, ft)(STND, m) | Flooding Likelihoods & Dates |
|---|---|---|
| Hilo, Hilo Bay, Kuhio Bay, HI | 1.00 ft0.30 m1.43 ft0.44 m2.25 ft0.69 m7.32 ft2.23 m | Medium ChanceOct 27–28 (peak 58.6%)Medium ChanceOct 26, 29 (23.7%–27.9%) |
| Kawaihae, HI | 1.00 ft0.30 m1.50 ft0.46 m2.19 ft0.67 m5.73 ft1.75 m | Medium ChanceOct 27–29 (peak 39.8%)Slight chanceOct 26, 30 (5.8%–13.5%) |
| Kahului, HI | 1.00 ft0.30 m1.35 ft0.41 m2.14 ft0.65 m5.66 ft1.73 m | Slight chanceOct 27–28 (peak 13.2%) |
| Nawiliwili, HI | 1.00 ft0.30 m1.40 ft0.43 m2.00 ft0.61 m5.11 ft1.56 m | Slight chanceOct 27–28 (peak 10.3%) |
Note: A harbor’s absence from this list does not mean flooding is impossible. It means NOAA either has no sufficiently validated model for that location, or the local hydrodynamics make a prediction unreliable. NOAA does not currently model any station in Alaska. Real-time weather can cause flooding at any coastal location regardless of this outlook — within five days, refer to the National Weather Service.
Where the risk is this month
Pin colour shows each harbor’s highest flood likelihood for the month. Select a pin for its dates and threshold.
Northeast 4 Harbors
Low lying areas may flood, however high tides alone will likely not cause a significant impact on the coast in most areas unless accompanied by a storm or strong winds. Lower than normal low tides will also occur.
| Harbor | Threshold (MHHW, ft)(MHHW, m)(MHW, ft)(MHW, m)(MSL, ft)(MSL, m)(STND, ft)(STND, m) | Flooding Likelihoods & Dates |
|---|---|---|
| Bridgeport, CT | 1.60 ft0.49 m1.94 ft0.59 m5.30 ft1.61 m10.90 ft3.32 m | Medium ChanceOct 27–28 (peak 42.1%)Medium ChanceOct 10–11, 25–26, 29 (20.1%–38.1%)Slight chanceOct 1, 8–9, 12, 24, 30 (10.1%–19.7%) |
| Kings Point, NY | 2.20 ft0.67 m2.56 ft0.78 m6.11 ft1.86 m22.89 ft6.98 m | Medium ChanceOct 27–28 (peak 29.5%)Slight chanceOct 1, 8–11, 25–26, 29 (5%–19.4%) |
| Boston, MA | 2.23 ft0.68 m2.67 ft0.81 m7.30 ft2.23 m16.03 ft4.88 m | Slight chanceOct 27–29 (peak 19.8%) |
| Portland, ME | 2.10 ft0.64 m2.53 ft0.77 m7.06 ft2.15 m20.55 ft6.26 m | Slight chanceOct 27–29 (peak 16.2%) |
Mid-Atlantic 10 Harbors
Minor tidal flooding along the coast will occur, particularly in low lying areas. If a storm occurs at this time, increased levels of tidal flooding and coastal erosion may occur. Lower than normal low tides will also occur.
| Harbor | Threshold (MHHW, ft)(MHHW, m)(MHW, ft)(MHW, m)(MSL, ft)(MSL, m)(STND, ft)(STND, m) | Flooding Likelihoods & Dates |
|---|---|---|
| Cape May Canal, NJ | 1.25 ft0.38 m1.69 ft0.52 m4.13 ft1.26 m9.12 ft2.78 m | Greatest ChanceOct 26–29 (peak 74.2%)Medium ChanceOct 1, 10–12, 25, 30 (43.9%–51.1%)Medium ChanceOct 2–9, 13, 24, 31 (20.1%–37.4%)Slight chanceOct 14–16, 22–23 (5.1%–19.3%) |
| Atlantic City, NJ | 1.40 ft0.43 m1.81 ft0.55 m3.79 ft1.15 m10.96 ft3.34 m | Greatest ChanceOct 27–28 (peak 63.4%)Medium ChanceOct 26, 29–30 (42.2%–57.2%)Medium ChanceOct 1–2, 9–13, 25, 31 (23.4%–34.6%)Slight chanceOct 3–8, 14–15, 23–24 (5.1%–19%) |
| Sandy Hook, NJ | 1.47 ft0.45 m1.80 ft0.55 m4.12 ft1.26 m9.21 ft2.81 m | Greatest ChanceOct 27 (peak 60%)Medium ChanceOct 26, 28 (51.2%–53.5%)Medium ChanceOct 9–12, 25, 29 (24.1%–37.7%)Slight chanceOct 1–4, 6–8, 13–14, 24, 30–31 (5.1%–19.2%) |
| Lewes, Breakwater Harbor, DE | 1.35 ft0.41 m1.77 ft0.54 m3.77 ft1.15 m8.78 ft2.68 m | Medium ChanceOct 26–30 (peak 59.7%)Medium ChanceOct 1–3, 7–13, 25, 31 (21.5%–39.2%)Slight chanceOct 4–6, 14–16, 23–24 (6.4%–19.9%) |
| Lewisetta, VA | 1.50 ft0.46 m1.64 ft0.50 m2.24 ft0.68 m7.77 ft2.37 m | Medium ChanceOct 1–14, 24–29 (peak 33.9%)Slight chanceOct 15–23, 30–31 (12.4%–19%) |
| Kiptopeke, VA | 1.56 ft0.48 m1.79 ft0.55 m3.08 ft0.94 m8.13 ft2.48 m | Medium ChanceOct 1, 10–11, 25–29 (peak 32.3%)Slight chanceOct 2–9, 12–15, 23–24, 30–31 (5.5%–19.6%) |
| Norfolk, VA | 1.75 ft0.53 m1.95 ft0.59 m3.15 ft0.96 m8.88 ft2.71 m | Medium ChanceOct 10–11, 26–29 (peak 26.8%)Slight chanceOct 1–9, 12–15, 23–25, 30–31 (6.6%–19.5%) |
| Windmill Point, VA | 1.66 ft0.51 m1.79 ft0.55 m2.35 ft0.72 m5.26 ft1.60 m | Medium ChanceOct 1, 10–11 (peak 20.9%)Slight chanceOct 2–9, 12–31 (5%–19.8%) |
| Wachapreague, VA | 2.02 ft0.62 m2.34 ft0.71 m4.24 ft1.29 m8.82 ft2.69 m | Slight chanceOct 1–2, 8–13, 25–30 (peak 19.4%) |
| New York (The Battery), NY | 2.15 ft0.65 m2.47 ft0.75 m4.63 ft1.41 m10.49 ft3.20 m | Slight chanceOct 26–28 (peak 11.6%) |
Southeast 8 Harbors
Some locations along the Southeast coast will have their highest tides of the year. Some stations along the Southeast coast are predicted to exceed the high tide flooding threshold based on tides alone. Minor tidal flooding along the coast will occur, particularly in low lying areas. If a storm occurs at this time, increased levels of tidal flooding and coastal erosion may occur. Lower than normal low tides will also occur.
| Harbor | Threshold (MHHW, ft)(MHHW, m)(MHW, ft)(MHW, m)(MSL, ft)(MSL, m)(STND, ft)(STND, m) | Flooding Likelihoods & Dates |
|---|---|---|
| Charleston, SC | 1.24 ft0.38 m1.59 ft0.49 m4.08 ft1.24 m9.77 ft2.98 m | Greatest ChanceOct 26–29 (peak 78.5%)Medium ChanceOct 10–11, 30 (45.2%–49.2%)Medium ChanceOct 1–2, 7–9, 12, 25, 31 (22.1%–39.5%)Slight chanceOct 3–6, 13–14, 24 (9.4%–19%) |
| Myrtle Beach (Springmaid Pier), SC | 1.40 ft0.43 m1.79 ft0.55 m4.29 ft1.31 m36.29 ft11.06 m | Greatest ChanceOct 27–28 (peak 66.1%)Medium ChanceOct 26, 29 (53.6%–56.7%)Medium ChanceOct 10–12, 25, 30 (25%–29.4%)Slight chanceOct 1–9, 13, 24, 31 (5.1%–19%) |
| Trident Pier, Cape Canaveral, FL | 1.76 ft0.54 m2.11 ft0.64 m3.81 ft1.16 m23.69 ft7.22 m | Medium ChanceOct 26–29 (peak 59.7%)Medium ChanceOct 30 (32%–32%)Slight chanceOct 1–3, 9–13, 24–25, 31 (5.9%–19%) |
| Beaufort, NC | 1.46 ft0.45 m1.75 ft0.53 m3.29 ft1.00 m6.84 ft2.08 m | Medium ChanceOct 27–28 (peak 44.5%)Medium ChanceOct 1, 10–11, 26, 29–30 (21.1%–33.7%)Slight chanceOct 2–4, 7–9, 12–14, 24–25, 31 (5.2%–16.3%) |
| Fort Pulaski, GA | 2.00 ft0.61 m2.37 ft0.72 m5.68 ft1.73 m13.00 ft3.96 m | Medium ChanceOct 27 (peak 40%)Medium ChanceOct 26, 28–29 (21.8%–38.4%)Slight chanceOct 9–12, 25, 30 (5.1%–9.7%) |
| Duck, NC | 1.81 ft0.55 m2.13 ft0.65 m3.73 ft1.14 m24.08 ft7.34 m | Medium ChanceOct 26–29 (peak 33.3%)Slight chanceOct 1–3, 8–14, 24–25, 30–31 (5.2%–17.4%) |
| Mayport Naval Station, St Johns R, FL | 1.79 ft0.55 m2.06 ft0.63 m4.28 ft1.30 m15.83 ft4.82 m | Medium ChanceOct 27–28 (peak 22.4%)Slight chanceOct 10–11, 26, 29 (5.7%–15.1%) |
| Fernandina Beach, FL | 2.00 ft0.61 m2.35 ft0.72 m5.27 ft1.60 m10.26 ft3.13 m | Slight chanceOct 26–29 (peak 12.8%) |
Gulf Coast 3 Harbors
In many locations of the Gulf Coast, the tidal range is relatively small compared to other regions of the U.S. so they will not be as significantly impacted by a perigean spring tide.
| Harbor | Threshold (MHHW, ft)(MHHW, m)(MHW, ft)(MHW, m)(MSL, ft)(MSL, m)(STND, ft)(STND, m) | Flooding Likelihoods & Dates |
|---|---|---|
| Port Isabel, TX | 1.13 ft0.34 m1.18 ft0.36 m1.69 ft0.51 m6.35 ft1.94 m | Greatest ChanceOct 1–4, 13–16, 26–31 (peak 95.1%)Greatest ChanceOct 5–6, 10–12, 17–19, 25 (62.7%–77.8%)Medium ChanceOct 7–9, 20–21, 24 (43.6%–54.3%)Medium ChanceOct 22–23 (36.9%–38.1%) |
| Bay Saint Louis, MS | 1.46 ft0.45 m1.60 ft0.49 m2.35 ft0.72 m5.61 ft1.71 m | Medium ChanceOct 1–4, 13–15, 27–31 (peak 36.6%)Slight chanceOct 5–6, 10–12, 16–19, 25–26 (7.5%–19.8%) |
| Naples, FL | 1.50 ft0.46 m1.75 ft0.53 m2.72 ft0.83 m6.51 ft1.98 m | Slight chanceOct 27–29 (peak 10.6%) |
West Coast 6 Harbors
Minor tidal flooding along the coast will occur, particularly in low lying areas. If a storm occurs at this time, increased levels of tidal flooding and coastal erosion may occur. Lower than normal low tides will also occur.
| Harbor | Threshold (MHHW, ft)(MHHW, m)(MHW, ft)(MHW, m)(MSL, ft)(MSL, m)(STND, ft)(STND, m) | Flooding Likelihoods & Dates |
|---|---|---|
| Los Angeles, CA | 1.50 ft0.46 m2.24 ft0.68 m4.16 ft1.27 m10.82 ft3.30 m | Greatest ChanceOct 27 (peak 83.7%)Medium ChanceOct 28 (48.3%–48.3%)Medium ChanceOct 26 (37.3%–37.3%)Slight chanceOct 29 (5.1%–5.1%) |
| Santa Monica, CA | 1.60 ft0.49 m2.34 ft0.71 m4.24 ft1.29 m9.47 ft2.89 m | Medium ChanceOct 27 (peak 59.9%)Medium ChanceOct 28 (28.1%–28.1%)Slight chanceOct 26 (9.5%–9.5%) |
| San Diego, CA | 1.80 ft0.55 m2.54 ft0.77 m4.58 ft1.40 m11.32 ft3.45 m | Medium ChanceOct 27 (peak 35.2%)Slight chanceOct 26, 28 (6%–6.2%) |
| North Spit, Humboldt Bay, CA | 1.90 ft0.58 m2.61 ft0.80 m5.06 ft1.54 m23.30 ft7.10 m | Medium ChanceOct 27–28 (peak 34.8%)Slight chanceOct 26, 29 (9.9%–14%) |
| La Jolla, CA | 1.70 ft0.52 m2.43 ft0.74 m4.30 ft1.31 m11.39 ft3.47 m | Slight chanceOct 27–28 (peak 15.7%) |
| Toke Point, Willapa Bay, WA | 2.10 ft0.64 m2.84 ft0.87 m6.24 ft1.90 m15.54 ft4.74 m | Slight chanceOct 26–28 (peak 12.4%) |
Hawaii 3 Harbors
Some stations in the Pacific Islands are predicted to exceed the high tide flooding threshold based on tides alone. Minor tidal flooding along the coast will occur, particularly in low lying areas. If a storm occurs at this time, increased levels of tidal flooding and coastal erosion may occur. Lower than normal low tides will also occur.
| Harbor | Threshold (MHHW, ft)(MHHW, m)(MHW, ft)(MHW, m)(MSL, ft)(MSL, m)(STND, ft)(STND, m) | Flooding Likelihoods & Dates |
|---|---|---|
| Hilo, Hilo Bay, Kuhio Bay, HI | 0.90 ft0.27 m1.33 ft0.41 m2.15 ft0.66 m7.22 ft2.20 m | Greatest ChanceOct 27–28 (peak 84.7%)Medium ChanceOct 26, 29 (53.6%–58.7%)Slight chanceOct 12, 25, 30 (6.3%–13.1%) |
| Kahului, HI | 0.80 ft0.24 m1.16 ft0.35 m1.94 ft0.59 m5.47 ft1.67 m | Greatest ChanceOct 27–28 (peak 78.2%)Medium ChanceOct 26 (49.3%–49.3%)Medium ChanceOct 29 (36.8%–36.8%)Slight chanceOct 25 (5.3%–5.3%) |
| Honolulu, HI | 0.70 ft0.21 m1.16 ft0.35 m1.78 ft0.54 m6.41 ft1.95 m | Greatest ChanceOct 27–28 (peak 70.6%)Medium ChanceOct 29 (56.2%–56.2%)Medium ChanceOct 26, 30 (26.4%–35.1%)Slight chanceOct 31 (6%–6%) |
Note: A harbor’s absence from this list does not mean flooding is impossible. It means NOAA either has no sufficiently validated model for that location, or the local hydrodynamics make a prediction unreliable. NOAA does not currently model any station in Alaska. Real-time weather can cause flooding at any coastal location regardless of this outlook — within five days, refer to the National Weather Service.
About this data
- Source
- NOAA Center for Operational Oceanographic Products and Services (CO-OPS), Monthly High Tide Flooding Outlook
- API
- Derived Products API (DPAPI), Daily Likelihoods endpoint
- Threshold
- NOS minor and NWS minor — both included
- Datum
- MHHW, MHW, MSL, STND — all included
- Units
- English (feet) and metric (metres) — both included
- Model run
- September 9, 2026
- Includes
- Harbors with at least one day at or above 5% flood likelihood
Flood likelihoods come from a probabilistic model combining tide predictions, sea level rise trends and seasonal changes in coastal sea level. The model does not account for real-time weather.