Tides Today & Tomorrow in Marion, MA
Featured Local Businesses

Printing our tide charts?
Help us keep our doors open and lights on by registering as a member of US Harbors.
It's simple and free!
Marion, MA Tides - Feb 2035
| Date | High Tide | Low Tide | Sun | Moon | ||||||||
|---|---|---|---|---|---|---|---|---|---|---|---|---|
| AM | ft | PM | ft | AM | ft | PM | ft | Rise | Set | |||
| 1 | Thu | 2:22 | 3.3 | 2:39 | 2.7 | 8:28 | 0.8 | 8:06 | 0.6 | 6:54 | 4:58 | ") |
| 2 | Fri | 3:20 | 3.2 | 3:39 | 2.7 | 9:36 | 0.7 | 9:10 | 0.5 | 6:53 | 4:59 | |
| 3 | Sat | 4:21 | 3.2 | 4:38 | 2.8 | 10:27 | 0.5 | 10:06 | 0.3 | 6:52 | 5:00 | |
| 4 | Sun | 5:12 | 3.3 | 5:28 | 3.0 | 11:10 | 0.3 | 10:54 | 0.1 | 6:51 | 5:02 | ") |
| 5 | Mon | 5:55 | 3.5 | 6:10 | 3.2 | 11:51 | 0.1 | 11:38 | -0.1 | 6:50 | 5:03 | |
| 6 | Tue | 6:32 | 3.8 | 6:48 | 3.5 | 12:30 | -0.1 | 6:49 | 5:04 | | ||
| 7 | Wed | 7:09 | 4.0 | 7:26 | 3.7 | 12:21 | -0.3 | 1:07 | -0.3 | 6:48 | 5:05 | |
| 8 | Thu | 7:45 | 4.1 | 8:05 | 3.9 | 1:03 | -0.5 | 1:43 | -0.5 | 6:47 | 5:07 | ") |
| 9 | Fri | 8:24 | 4.2 | 8:45 | 4.0 | 1:44 | -0.6 | 2:16 | -0.6 | 6:45 | 5:08 | |
| 10 | Sat | 9:05 | 4.2 | 9:28 | 4.0 | 2:24 | -0.6 | 2:49 | -0.7 | 6:44 | 5:09 | |
| 11 | Sun | 9:49 | 4.1 | 10:13 | 4.1 | 3:03 | -0.6 | 3:23 | -0.7 | 6:43 | 5:11 | |
| 12 | Mon | 10:37 | 4.0 | 11:03 | 4.1 | 3:44 | -0.5 | 4:00 | -0.6 | 6:42 | 5:12 | ") |
| 13 | Tue | 11:29 | 3.8 | 11:56 | 4.0 | 4:28 | -0.3 | 4:43 | -0.5 | 6:40 | 5:13 | |
| 14 | Wed | 12:24 | 3.7 | 5:21 | 0.0 | 5:33 | -0.3 | 6:39 | 5:14 | | ||
| 15 | Thu | 12:53 | 4.0 | 1:22 | 3.5 | 6:30 | 0.3 | 6:34 | -0.1 | 6:38 | 5:16 | ") |
| 16 | Fri | 1:53 | 4.0 | 2:24 | 3.5 | 8:19 | 0.3 | 7:47 | 0.0 | 6:36 | 5:17 | |
| 17 | Sat | 2:59 | 4.1 | 3:31 | 3.6 | 9:57 | 0.2 | 9:06 | -0.1 | 6:35 | 5:18 | |
| 18 | Sun | 4:08 | 4.2 | 4:38 | 3.8 | 10:57 | 0.0 | 10:17 | -0.3 | 6:34 | 5:19 | |
| 19 | Mon | 5:13 | 4.4 | 5:38 | 4.1 | 11:47 | -0.2 | 11:16 | -0.5 | 6:32 | 5:21 | ") |
| 20 | Tue | 6:09 | 4.7 | 6:32 | 4.5 | 12:32 | -0.4 | 6:31 | 5:22 | | ||
| 21 | Wed | 7:00 | 4.8 | 7:21 | 4.7 | 12:09 | -0.6 | 1:13 | -0.5 | 6:29 | 5:23 | |
| 22 | Thu | 7:47 | 4.8 | 8:09 | 4.8 | 12:59 | -0.7 | 1:49 | -0.6 | 6:28 | 5:24 | ") |
| 23 | Fri | 8:32 | 4.7 | 8:55 | 4.7 | 1:45 | -0.7 | 2:21 | -0.6 | 6:26 | 5:25 | |
| 24 | Sat | 9:17 | 4.5 | 9:40 | 4.5 | 2:28 | -0.6 | 2:51 | -0.5 | 6:25 | 5:27 | |
| 25 | Sun | 10:00 | 4.1 | 10:25 | 4.2 | 3:08 | -0.4 | 3:23 | -0.3 | 6:23 | 5:28 | |
| 26 | Mon | 10:45 | 3.8 | 11:11 | 3.9 | 3:47 | -0.2 | 3:57 | -0.1 | 6:22 | 5:29 | ") |
| 27 | Tue | 11:30 | 3.4 | 11:58 | 3.6 | 4:27 | 0.1 | 4:34 | 0.1 | 6:20 | 5:30 | |
| 28 | Wed | 12:16 | 3.1 | 5:11 | 0.4 | 5:16 | 0.3 | 6:19 | 5:31 | | ||
| Date | High Tide | Low Tide | Sun | Moon | ||||||||
| AM | ft | PM | ft | AM | ft | PM | ft | Rise | Set | |||
www.USHarbors.com
© 2026 US Harbors LLC All rights reserved
The US Harbors tide chart design is protected by copyright. It may be printed for personal use only.
Any commercial use, modification, redistribution, or repackaging without written permission is strictly prohibited.
Common Questions About Marion, MA Tides
Show AllWhat time does the tide turn (slack tide) in Marion, MA today?
Slack tide in Marion, MA is approximately 11:03 am — midway between the next high and low tide, when tidal current is weakest. This is the preferred window for boat crossings, underwater visibility, and fishing in areas with strong currents.
Is this week a spring tide or neap tide in Marion, MA?
Marion, MA is currently in a neap phase. Tonight's moon is 47% illuminated. Spring tides (largest swings) occur near new and full moons; neap tides (smallest swings) occur near first and third quarter moons. Tidal ranges this week are near their weekly minimum.
What datum are Marion, MA tide heights measured from?
Tide heights on this page are measured from Mean Lower Low Water (MLLW), the U.S. NOAA standard. A height of 0 ft represents the 19-year average of each day's lower low tide. Negative values indicate a "minus tide" — water levels below that long-term reference.
What factors can affect the tide predictions for Marion, MA?
Tide predictions for Marion, MA come from NOAA's harmonic analysis and are typically accurate within about ±10 minutes on timing and ±0.5 ft on height. Actual water levels can deviate further due to sustained winds, atmospheric pressure changes, river flow, and storm surge. During major weather events, be sure to check US Harbors weather pages for factors that could impact tidal predictions.
Which NOAA station provides tide data for Marion, MA?
Tide data for Marion, MA is sourced from NOAA Station #8447385. View the official NOAA station page at https://tidesandcurrents.noaa.gov/stationhome.html?id=8447385.
What is the moon phase in Marion, MA tonight?
Tonight the moon over Marion, MA is Third Quarter (47% illuminated). This places Marion, MA in a neap tide cycle, so tidal ranges are near their weekly minimum this week.
US Harbors Tidal Data
The data in our tide charts, tide tables, and tide graphs is provided by NOAA and others. These predictions are derived mathematically from numerous inputs, including data from historical tide stations and nearby locations where sensors are actively recording. As shown in the tide graph at the top of this page, “Predicted” tides (blue) are what forecasting models expect to happen. “Observed” tides (red) are those recorded by local sensors in real time, overlaid on the predictions for direct comparison. We display Observed water levels for a select group of harbors including Portland, Maine, where a physical sensor monitors water levels in real time.
FEATURED CONTENT
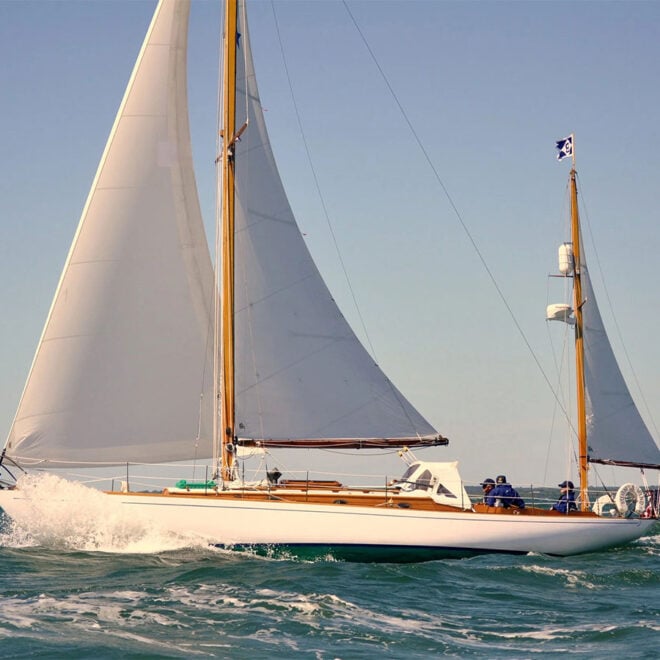
In The Zone: The Sabre 51 Salon Express
By US Harbors When Sabre Yachts completed construction of hull number 200 of its 48 Salon Express model, more than half the crew who built it had also worked on hull number one. The average tenure on that line was 12 years, and they produced a yacht that proved to… Learn More
Coastal News Updates See All
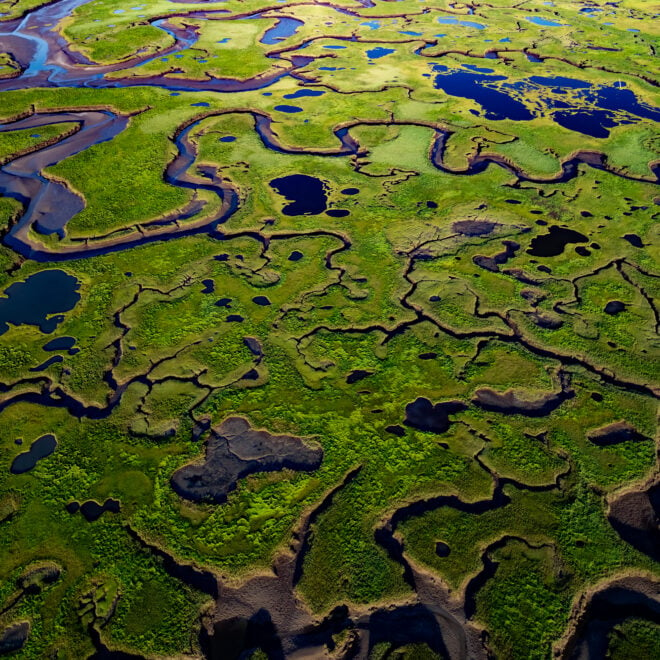
The Coast Is Clear-er: NOAA Unveils New Land Cover Maps 900 Times Greater In Detail
By noaa.gov, noaa.gov. NOAA is releasing new, higher-resolution land cover maps for coastal Alabama, Mississippi,… More
![Coral bleaching at Cheeca Rocks in the Florida Keys in 2023. [Credit: NOAA]](https://www.usharbors.com/wp-content/uploads/2026/06/NOAA_Cheeca-Rocks_07312023_7-e.jpg-660x660.webp)
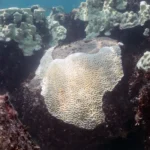
World’s Fourth Mass Coral Bleaching Event Likely Ended in 2025
By nesdis.noaa.gov, nesdis.noaa.gov. After analyzing satellite data and bleaching observations, NOAA’s experts say the record-breaking… More
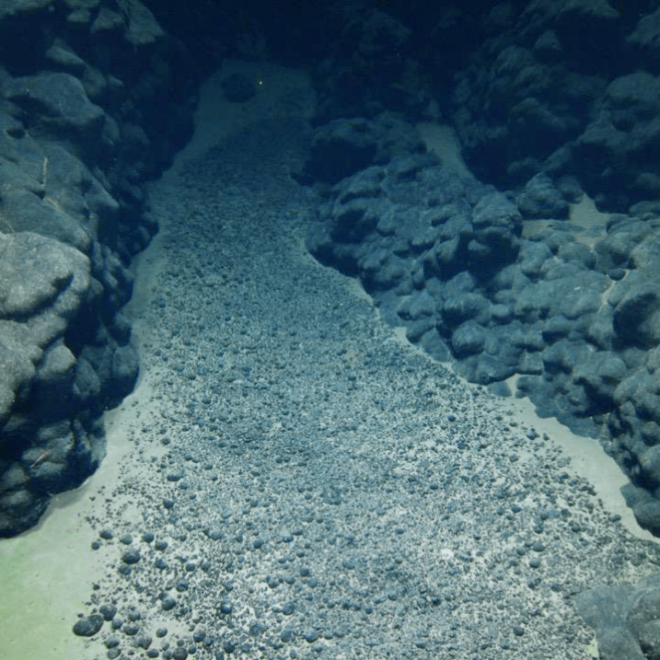
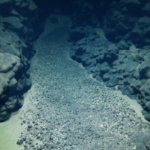
NOAA Scientists and Partners to Map Deep Waters, Seabed in the Cook Islands
By noaa.gov, noaa.gov. This summer, NOAA Ocean Exploration will conduct an expedition on NOAA Ship Okeanos… More
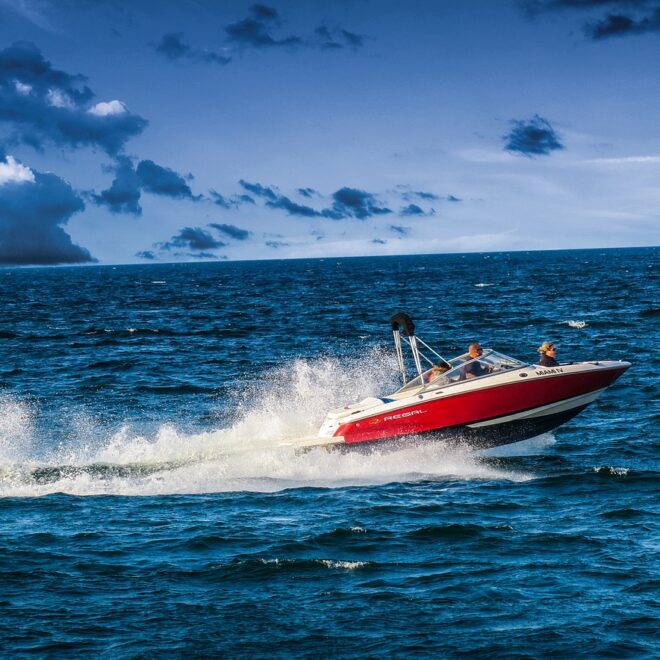
What Is a Safe Speed for Your Boat? It Depends on More Than You Think
By John Tiger, boatingmag.com. With summer boating season in full swing, one of the most… More

Pink Salmon Invasion in Great Lakes Has Lessons for North Atlantic, Arctic Communities
By fisheries.noaa.gov, fisheries.noaa.gov. New NOAA-led research on the history of the rise of pink salmon… More
Anchoring to Fish vs. Anchoring to Sleep: Why the Technique — and the Tackle — Should Change
By Jim Hendricks, boatingmag.com. Anchoring is one of the most fundamental skills in boating, yet… More
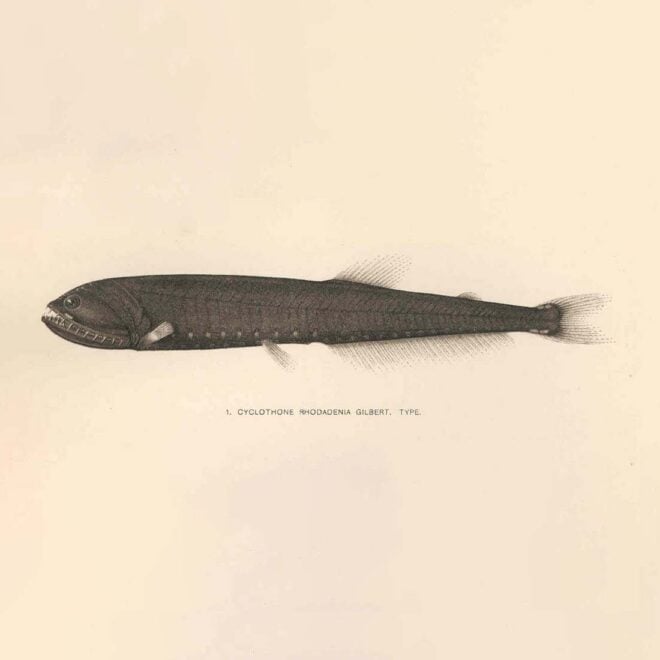
The Ocean's Most Abundant Fish Evolved in Extreme Heat — and That May Be Good News
By Daniel Hentz, whoi.edu. The most numerous fish in the ocean isn't one most boaters… More
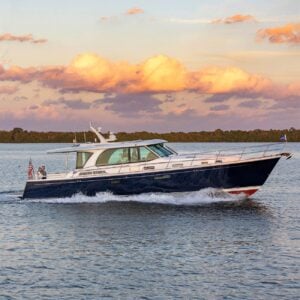
Port of Everett Marina: A Complete Guide to the West Coast's Largest Public Marina
By Dawn Anderson, best4boats. With 2,300 slips and over 3,000 acres of waterfront — more… More
The Container Ship That's Also an Ocean Science Lab
By Amy E. Nevala, whoi.edu. Some of the most valuable ocean data in the Atlantic… More